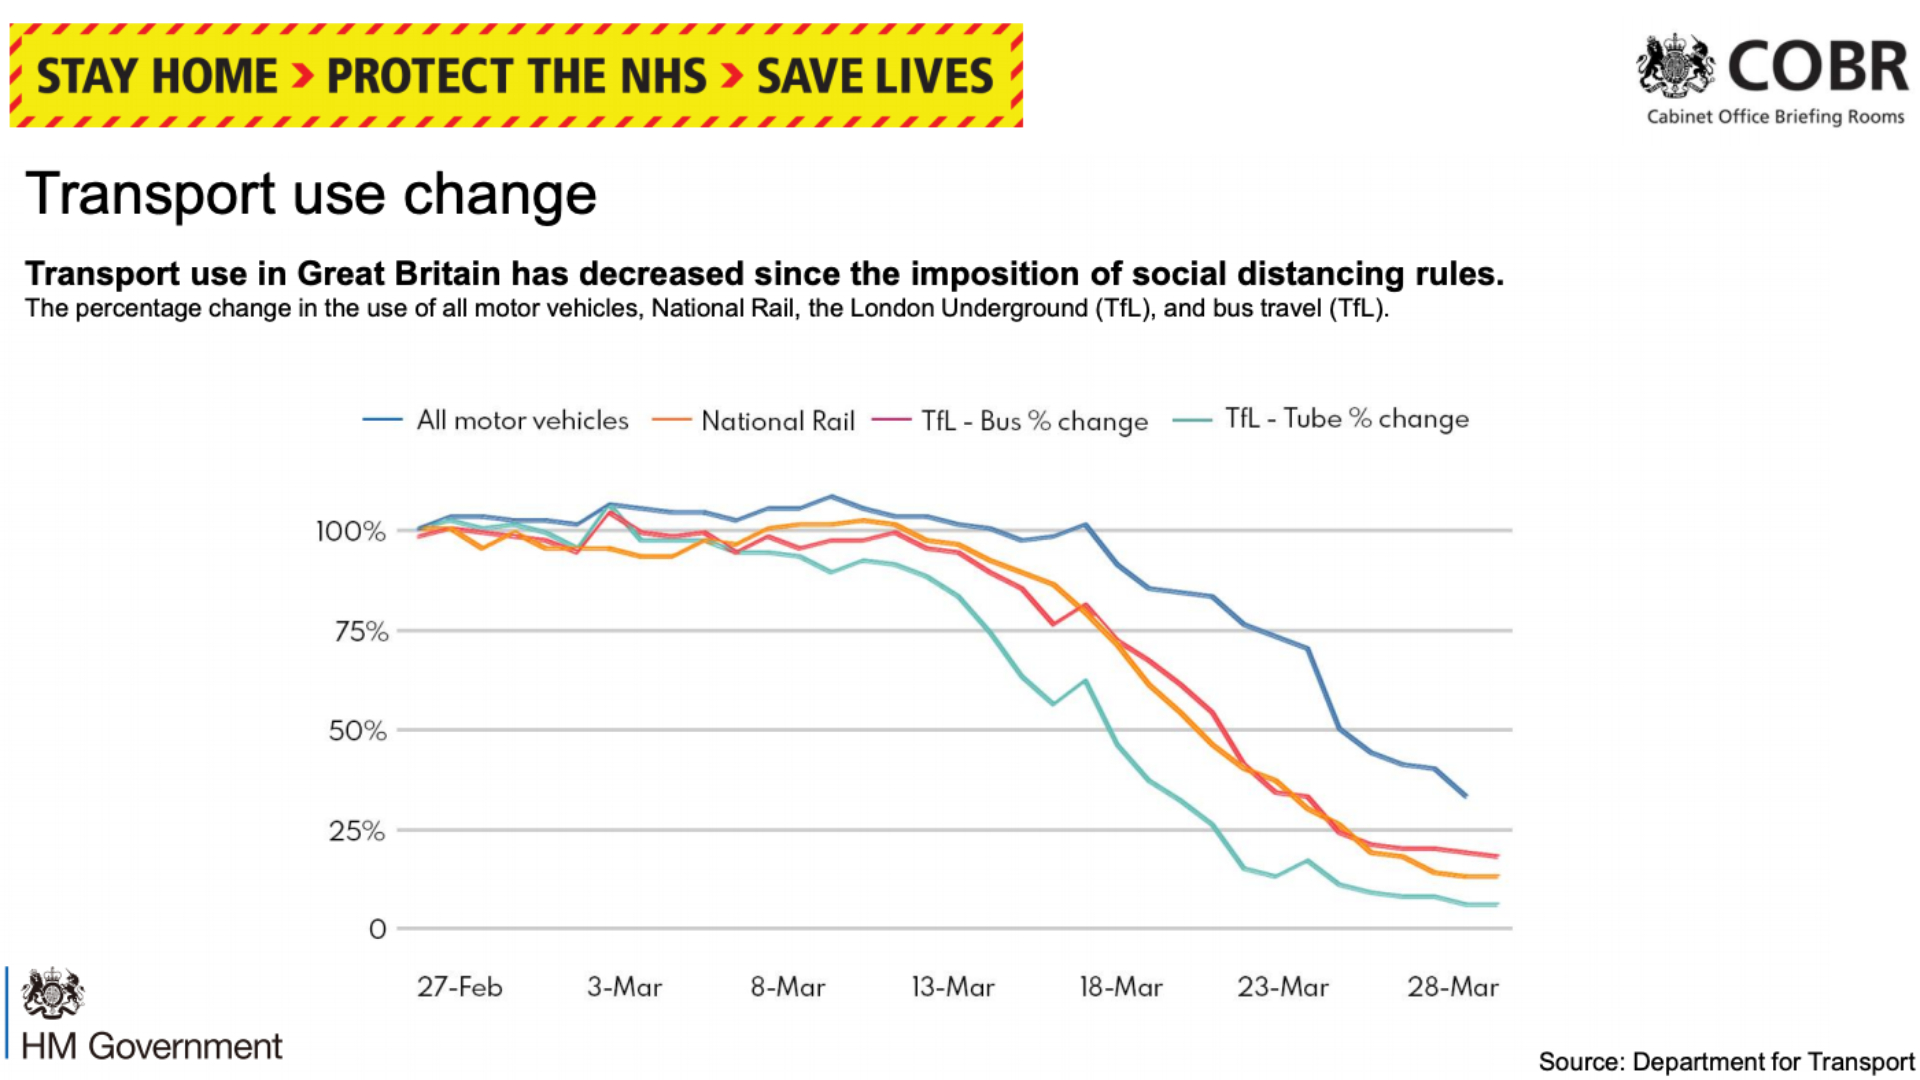
The Department of Transport has published figures that reveal how various modes of transport have been affected by the coronavirus crisis.
The graph below shows motor vehicles, national railways, London (TfL) buses and the London Underground.

- Coronavirus: MG donates 100 ZS EVs to the NHS
On February 27, everything is at 100 percent. By 3 March, the underground shows its first sign of decline.
By 18 March, tube use had halved, while bus use was at just over 75 percent. Travel by National Rail experienced a similar drop, at around 75 percent. Travel by car, meanwhile, had only just started to drop off by March 18.
However, the rate of drop after this date – around when the UK ‘lockdown’ first began – is enormous. By 25 March, car driving was down to 50 percent, dropping almost overnight from 75 percent. At this point, the three forms of public transport are down at or below 25 percent.

It’s difficult to compare these figures with UK cases of the virus, hospital admissions and the death rate, due to incubation periods, testing availability and so on.
However, in terms of new cases, the so-called curve appears to have softened, with the first drop-off occurring on 28 March, following the stark jump on 27 March.
The real effects of the social distancing measures, evidenced in these transport figures, will only be visible in the longer term. For now, at least, it seems that most of the population has listened and stayed at home.