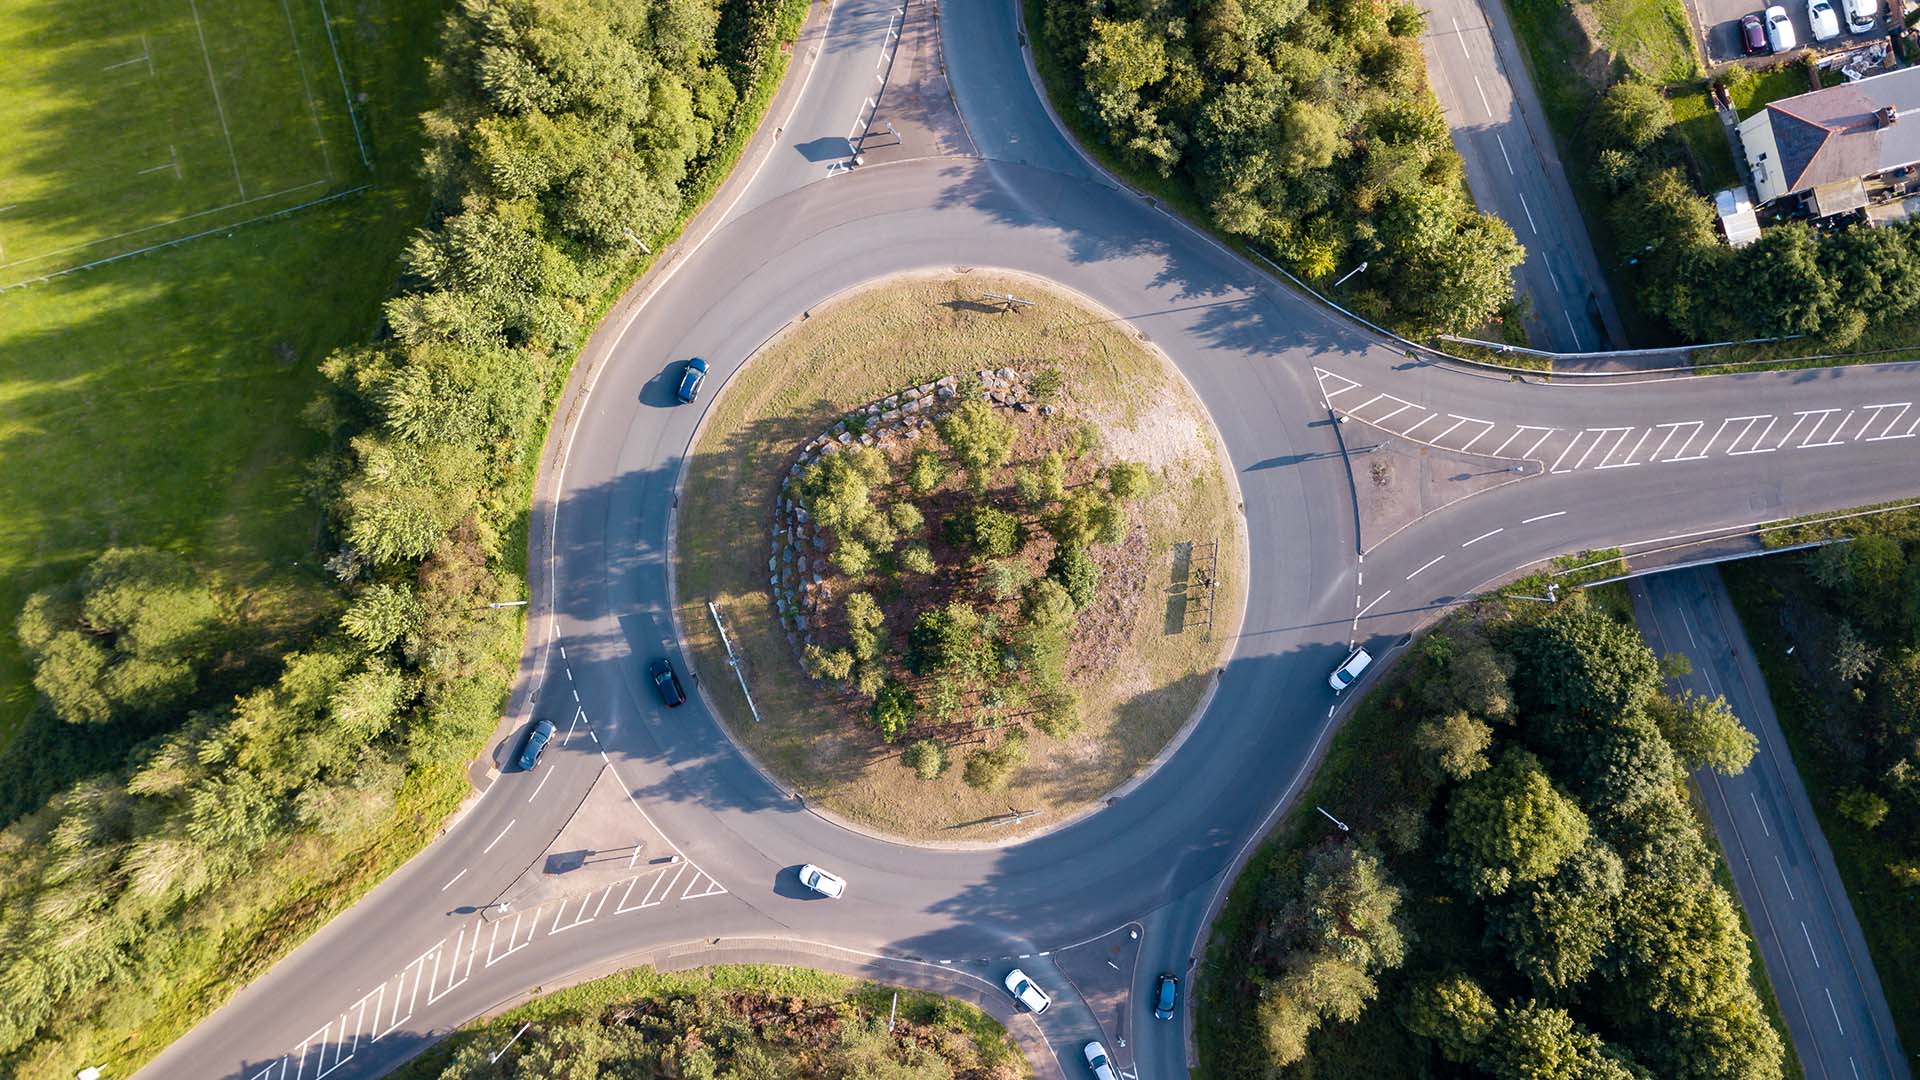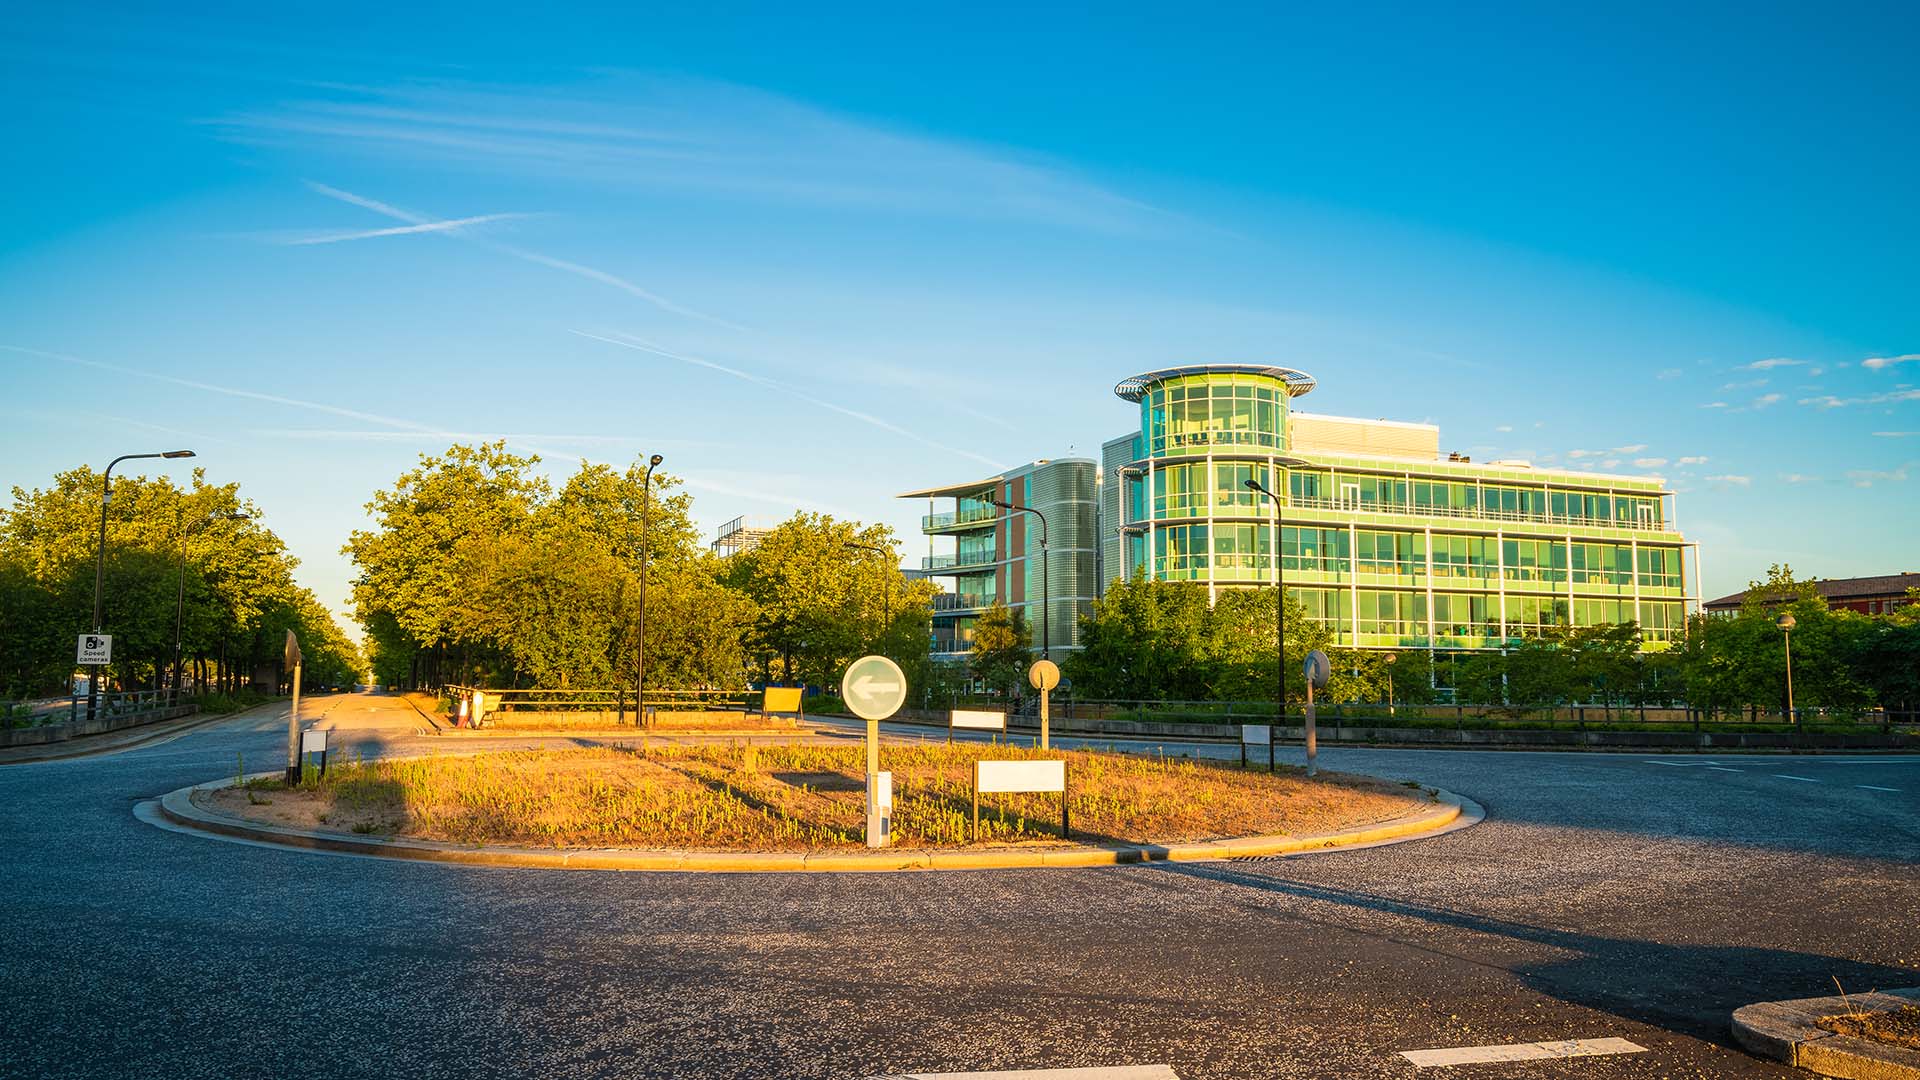
Roundabouts could be good for your health. That’s according to a recent study of air pollution levels.
Scientists from the Birmingham Institute of Forest Research and the Lancaster University Environment Centre looked at the UK’s 146 most populous urban areas.
They wanted to discover if there’s a correlation between a town’s layout and the levels of pollution.
The 146 largest conurbations were ranked by their NOx emission levels, with the data overlaid with the size of the population. Taking this into account, Milton Keynes is the city ‘most improved by urban form’.
‘Roundabouts do two things’
Speaking to the BBC, lead author of the study, Professor Rob Mackenzie, said: “The Milton Keynes roundabouts do two things – they reduce stop-start driving which reduces production of pollution, and they make space to help the pollution dilute and mix away.
“Milton Keynes has taken up much more space for its people and its transport which means the pollution it produces is diluted in a greater space.”
Just 23 miles down the road in Luton, the story is less positive. The town’s compact and built-up nature means fumes are unable to disperse as easily.
“Luton is much more compact so it doesn’t gain from that dilution benefit. The biggest effect green spaces have on air pollution in urban areas is to provide space for that pollution to disperse.”

Crucially, the two towns produce roughly the same amount of pollution for their size. But the air in Luton is much dirtier, because the pollution is trapped by tight roads and building. Conversely, the roundabouts, boulevards and open roads of Milton Keynes allow the poisonous gases to escape.
Professor Mackenzie said towns like Luton cannot “rely on the dilution effect of it being spread out to avoid the problem”.
“I’d be advocating that Luton recognise that their particular situation puts them at a relative disadvantage, so they ought to work even harder at driving down emissions from traffic.”
The following tables show the best and worst urban areas when it comes to dispersing pollution. The rankings are based on the percentage change relative to the 146 largest areas in the country.
Top 10 most improved by urban form
| Urban area | Percentage change |
| 1. Milton Keynes | 22% |
| 2. Stoke-on-Trent | 21% |
| 3. Weybridge | 20% |
| 4. Aldershot | 19% |
| 5. Macclesfield | 18% |
| 6. Livingston | 18% |
| 7. Swansea | 16% |
| 8. Manchester | 16% |
| 9. High Wycombe | 14% |
| 10. Birmingham | 14% |
Top 10 least improved by urban form
| Urban area | Percentage change |
| 1. Luton | -24% |
| 2. Crawley | -15% |
| 3. Leamington Spa | -13% |
| 4. Cardiff | -12% |
| 5. Coventry | -12% |
| 6. Stevenage | -12% |
| 7. Tamworth | -12% |
| 8. Bradford | -12% |
| 9. Oxford | -12% |
| 10. Worcester | -12% |